BodyClocks

User Guide

A visual walkthrough of the main BodyClocks workflows. Click on an image to enlarge.
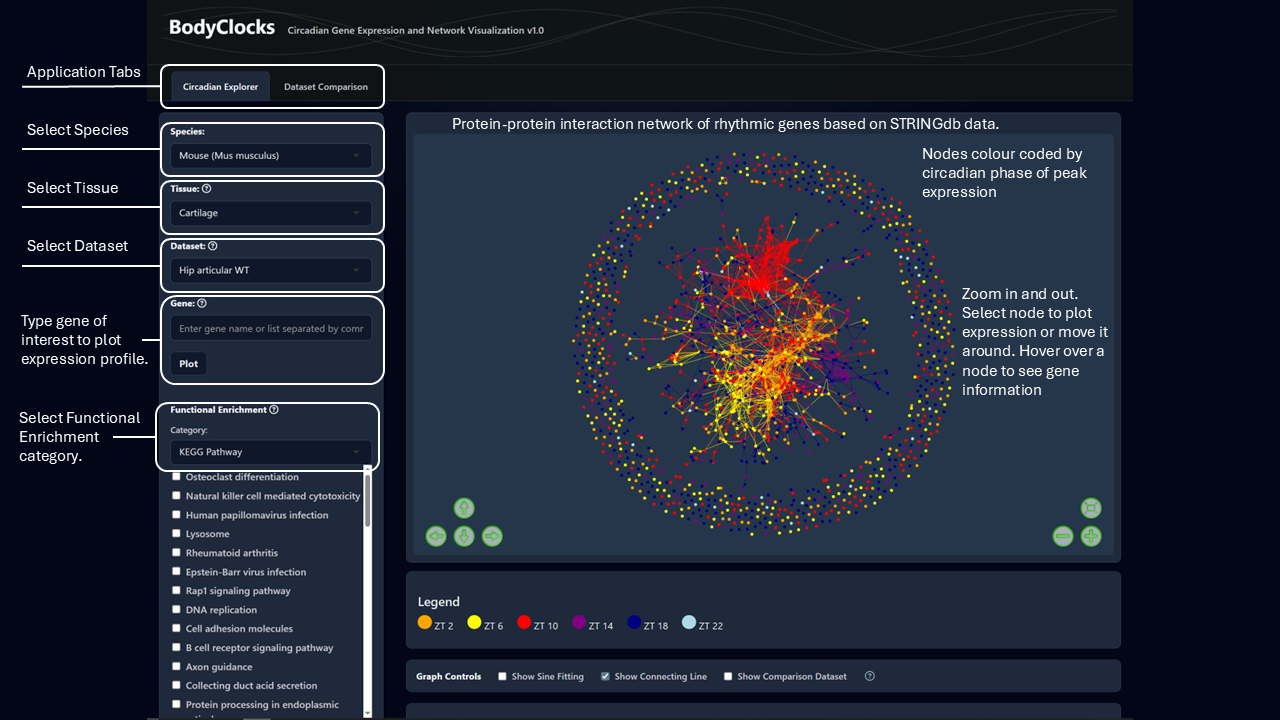
Circadian Explorer

Select the Circadian Explorer tab, choose species, tissue, dataset, gene, and enrichment category, then inspect the network.

Circadian Explorer interface showing how to choose the app tab, species, tissue, dataset, gene, enrichment category, and network controls.

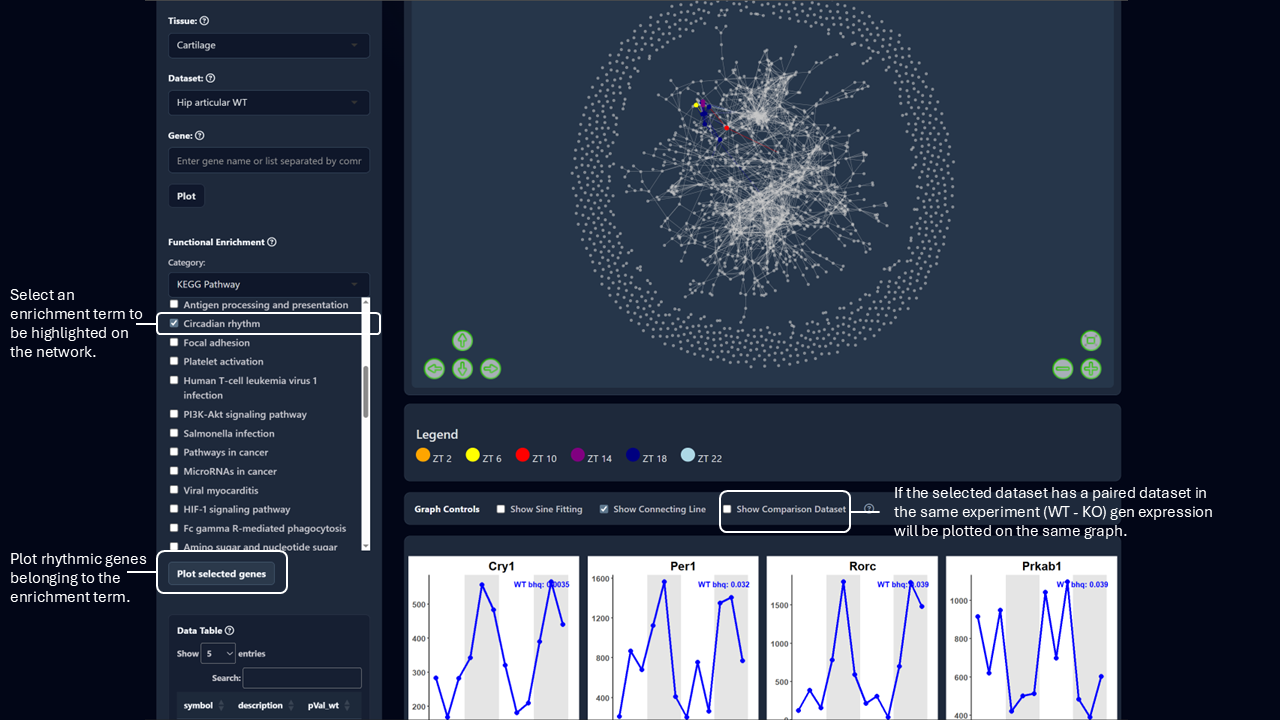
Highlight an enrichment term on the network, plot genes from that term, and toggle paired comparison expression plots.

Circadian Explorer interface showing enrichment term selection, highlighted network genes, expression plots, and the comparison dataset toggle.

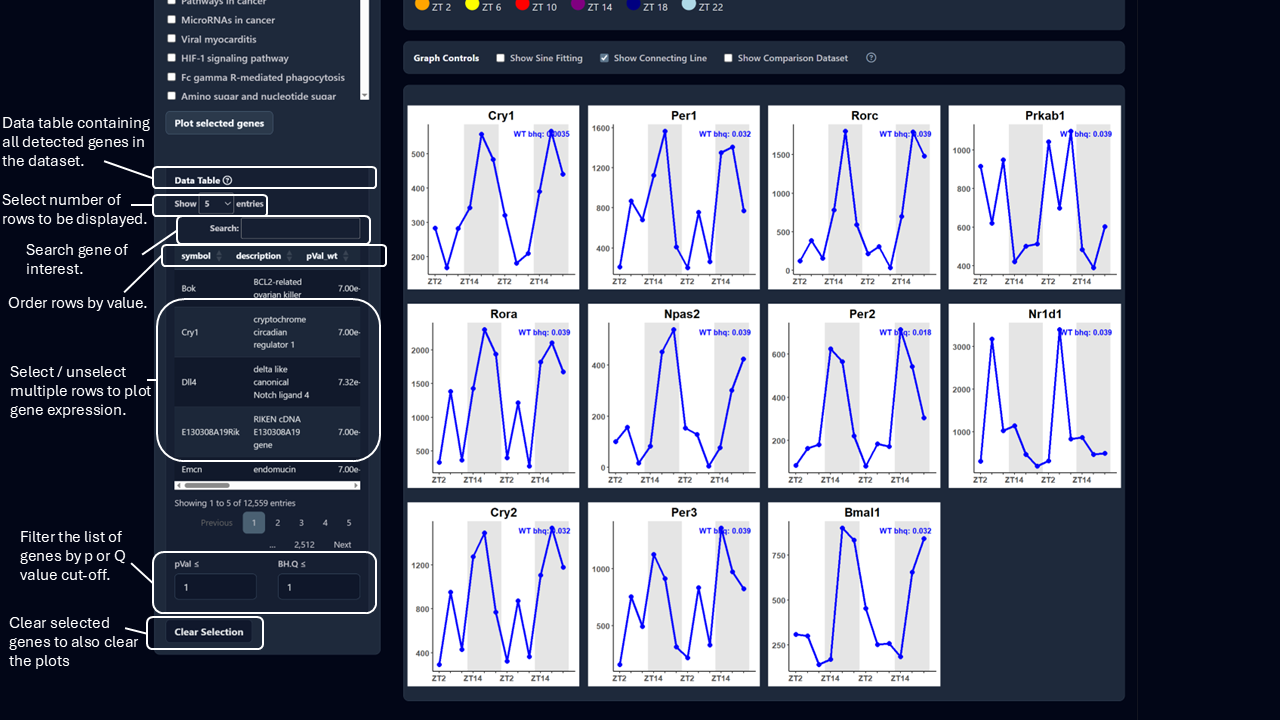
Use the detected-gene table to search, sort, filter by p value or Q value, select genes, and clear plots.
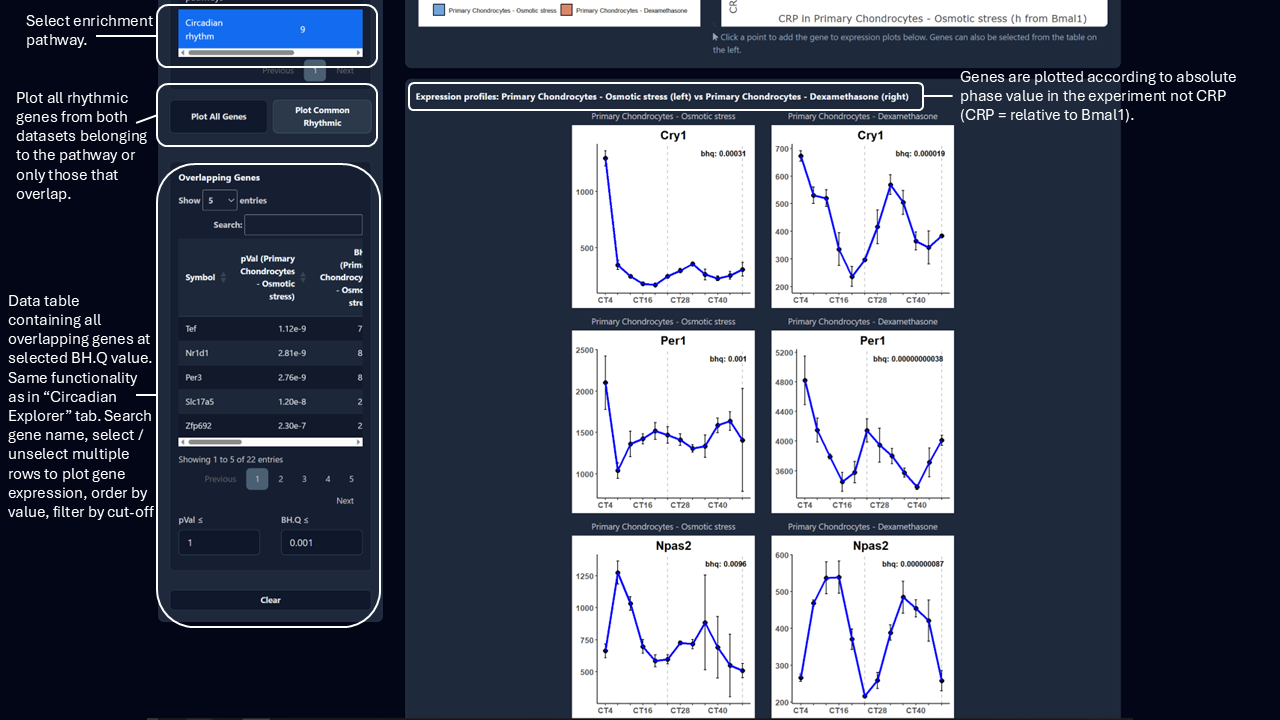
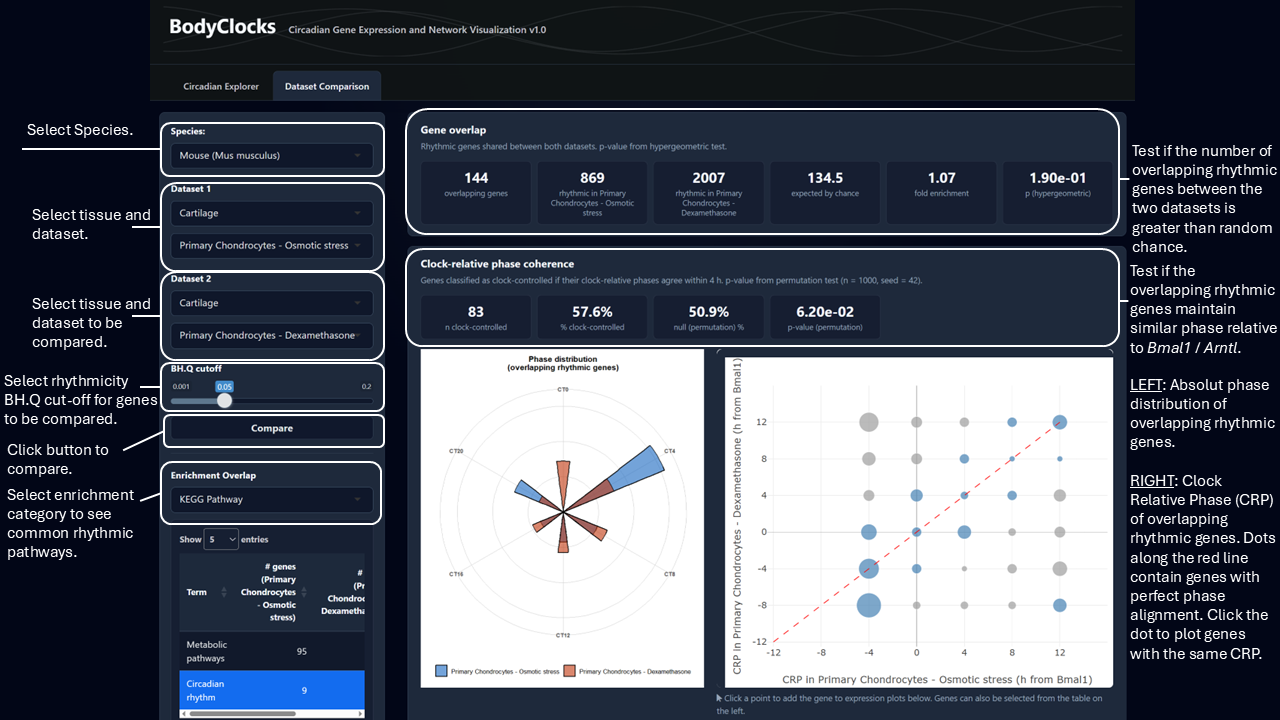
Circadian Explorer data table showing search, sort, row selection, p value and Q value filters, and the clear selection control.

Dataset Comparison

Choose two datasets, set the BH.Q cutoff, compare overlap, phase coherence, enrichment overlap, and clock-relative phase views.

Dataset Comparison interface showing species, dataset selections, rhythmicity cutoff, compare button, overlap statistics, phase coherence, and enrichment overlap.

Explore shared rhythmic genes from selected pathways, plot all or common rhythmic genes, and search or filter overlapping genes.

Dataset Comparison interface showing enrichment pathway selection, all or common rhythmic gene plotting, overlapping gene table search, selection, sorting, and filters.